The pytseries.core.TimeSeries Object
pytseries.core.TimeSeries
object for storing and manipulating pytseries data.
Create a time series object
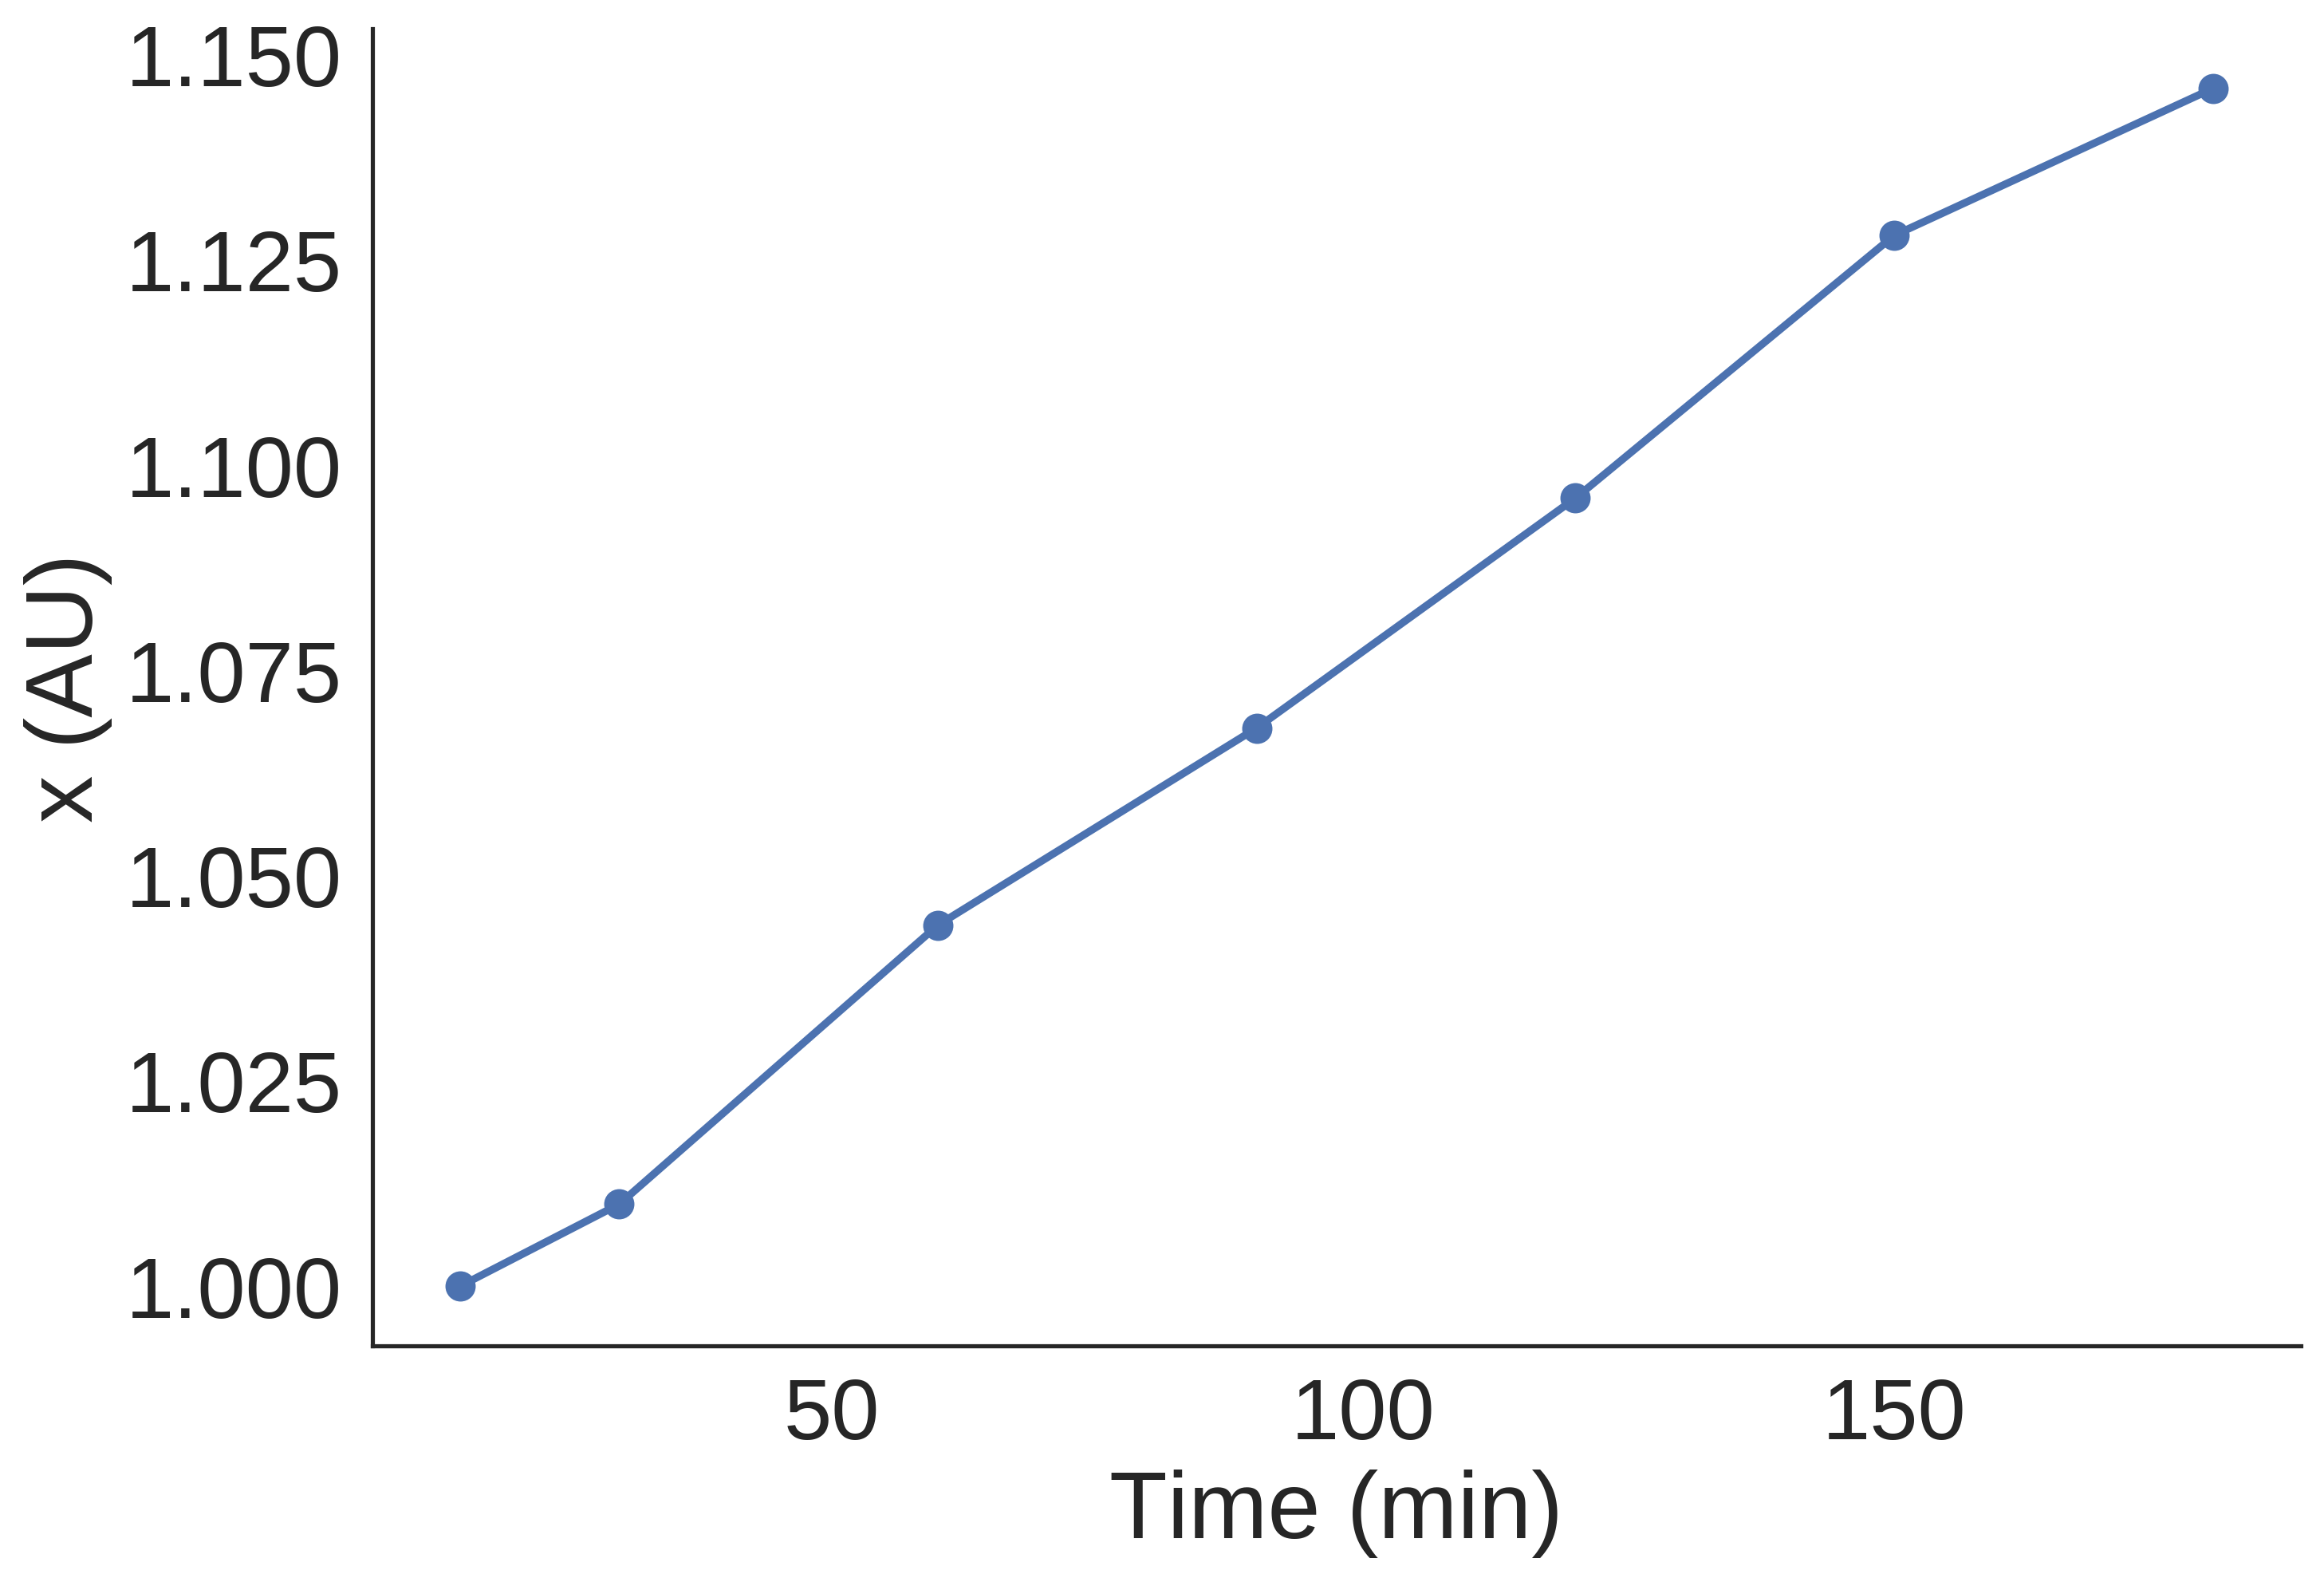
>>> time = [15, 30, 60, 90, 120, 150, 180]
>>> x_values = [1, 1.01, 1.044, 1.068, 1.096, 1.128, 1.1459]
>>> ts = TimeSeries(time=time, values=x_values, feature='x')
>>> print(ts)
out: TimeSeries(data=[1.0, 1.01, 1.044, 1.068, 1.096, 1.128, 1.1459], \
time=[15, 30, 60, 90, 120, 150, 180], feature="x")
Perform numerical operations on TimeSeries
>>> time = [15, 30, 60, 90, 120, 150, 180]
>>> x_values = [1, 1.01, 1.044, 1.068, 1.096, 1.128, 1.1459]
>>> y_values = [0.989, 1.031, 1.233, 1.205, 1.158, 1.176, 1.204]
>>> tsx = TimeSeries(time=time, values=x_values, feature='x')
>>> tsy = TimeSeries(time=time, values=y_values, feature='y')
>>> tsx + tsy
Out: TimeSeries(data=[1.9889999999999999, 2.041, 2.277, 2.273, 2.254, 2.304, 2.3499], time=[15, 30, 60, 90, 120, 150, 180], feature=None)
>>> tsx * tsy
Out: TimeSeries(data=[0.989, 1.04131, 1.287252, 1.2869400000000002, 1.269168, 1.3265279999999997, 1.3796635999999998], time=[15, 30, 60, 90, 120, 150, 180], feature=None)
>>> tsx / tsy
Out: TimeSeries(data=[1.0111223458038423, 0.979631425800194, 0.8467153284671532, 0.8863070539419087, 0.9464594127806565, 0.9591836734693877, 0.9517441860465116], time=[15, 30, 60, 90, 120, 150, 180], feature=None)
>>> tsx - tsy
Out: TimeSeries(data=[0.01100000000000001, -0.020999999999999908, -0.18900000000000006, -0.137, -0.06199999999999983, -0.04800000000000004, -0.05810000000000004], time=[15, 30, 60, 90, 120, 150, 180], feature=None)
>>> tsx ** 2
Out: TimeSeries(data=[1.0, 1.0201, 1.089936, 1.140624, 1.2012160000000003, 1.2723839999999997, 1.3130868099999997], time=[15, 30, 60, 90, 120, 150, 180], feature=None)
Indexing operations
>>> tsx = TimeSeries(time=time, values=x_values, feature='x')
>>> tsx[15]
Out: 0.989
Distance Operations
>>> tsx.eucl_dist(tsy)
Out: 0.06457561
Collecting metrics
>>> tsx.max()
Out: (180, 1.1459)
>>> tsx.min()
Out: (15, 1.0)
Normalization
>>> tsx.norm(inplace=True)
Out: TimeSeries(data=[0.0, 0.0685, 0.3015, 0.466, 0.657, 0.877, 1.0], time=[15, 30, 60, 90, 120, 150, 180], feature="x")
Coercion
To numpy.array
>>> tsx.to_array()
Out: [[ 15.       1.    ]
      [ 30.       1.01  ]
      [ 60.       1.044 ]
      [ 90.       1.068 ]
      [120.       1.096 ]
      [150.       1.128 ]
      [180.       1.1459]]
The pytseries.core.TimeSeriesGroup Object
Object for collecting a group of time series
Create TimeSeriesGroup object from list of TimeSeries
>>> time = [15, 30, 60, 90, 120, 150, 180]
>>> x_values = [1, 1.01, 1.044, 1.068, 1.096, 1.128, 1.1459]
>>> y_values = [0.989, 1.031, 1.233, 1.205, 1.158, 1.176, 1.204]
>>> tsx = TimeSeries(time=time, values=x_values, feature='x')
>>> tsy = TimeSeries(time=time, values=y_values, feature='y')
>>> tsg = TimeSeriesGroup([tsx, tsy])
out  15     30     60     90     120    150     180
x  1.000  1.010  1.044  1.068  1.096  1.128  1.1459
y  0.989  1.031  1.233  1.205  1.158  1.176  1.2040
Create TimeSeriesGroup object from list of pandas.DataFrame
>>> df = pandas.DataFrame([x_values, y_values], columns=time, index=['x', 'y'])
>>> tsg = TimeSeriesGroup(df)
>>> tsg
    15     30     60     90     120    150     180
x  1.000  1.010  1.044  1.068  1.096  1.128  1.1459
y  0.989  1.031  1.233  1.205  1.158  1.176  1.2040
Append TimeSeries to TimeSeriesGroup
>>> z_values = [i*2 for i in y_values]
>>> tsz = TimeSeries(time=time, values=z_values, feature='z')
>>> tsg.append(tsz, inplace=True)
Out: 15     30     60     90     120    150     180
x  1.000  1.010  1.044  1.068  1.096  1.128  1.1459
y  0.989  1.031  1.233  1.205  1.158  1.176  1.2040
z  1.978  2.062  2.466  2.410  2.316  2.352  2.4080
Concatonate two TimeSeriesGroup objects
>>> a_values = [i*3 for i in y_values]
>>> tsa = TimeSeries(time=time, values=a_values, feature='a')
>>> tsg1 = TimeSeriesGroup([tsx, tsy])
>>> tsg2 = TimeSeriesGroup([tsa, tsz])
>>> tsg = tsg1.concat(tsg2)
Out: 15     30     60     90     120    150     180
x  1.000  1.010  1.044  1.068  1.096  1.128  1.1459
y  0.989  1.031  1.233  1.205  1.158  1.176  1.2040
a  2.967  3.093  3.699  3.615  3.474  3.528  3.6120
z  1.978  2.062  2.466  2.410  2.316  2.352  2.4080
Indexing a pytseries.core.TimeSeriesGroup
The pytseries.core.TimeSeriesGroup is designed to work like a pandas.DataFrame
>>> tsg.loc['x']
15     1.0000
30     1.0100
60     1.0440
90     1.0680
120    1.0960
150    1.1280
180    1.1459
Name: x, dtype: float64
Note
The loc indexer currently returns a pandas.Series object. It would make more sense for a TimeSeries to be returned and this will be changed in future versions.
>>> time = [15, 30, 60, 90, 120, 150, 180]
>>> x_values = [1, 1.01, 1.044, 1.068, 1.096, 1.128, 1.1459]
>>> y_values = [0.989, 1.031, 1.233, 1.205, 1.158, 1.176, 1.204]
>>> z_values = [i*2 for i in y_values]
>>> df = pandas.DataFrame([x_values, y_values, z_values], columns=time, index=['x', 'y', 'z'])
>>> tsg = TimeSeriesGroup(df)
>>> tsg
Out: 15     30     60     90     120    150     180
x  1.000  1.010  1.044  1.068  1.096  1.128  1.1459
y  0.989  1.031  1.233  1.205  1.158  1.176  1.2040
z  1.978  2.062  2.466  2.410  2.316  2.352  2.4080
>>> tsg.loc[['x', 'y']])
Out: 15     30     60     90     120    150     180
x  1.000  1.010  1.044  1.068  1.096  1.128  1.1459
y  0.989  1.031  1.233  1.205  1.158  1.176  1.2040
The pandas.DataFrame.iloc indexer works as expected
>>> tsg.iloc[[0, 1]]
Out: 15     30     60     90     120    150     180
x  1.000  1.010  1.044  1.068  1.096  1.128  1.1459
y  0.989  1.031  1.233  1.205  1.158  1.176  1.2040
Return the shape of a TimeSeriesGroup
>>> tsg.shape
(3, 7)
Calcualte statistics on TimeSeriesGroups
>>> time = [15, 30, 60, 90, 120, 150, 180]
>>> x_values = [1, 1.01, 1.044, 1.068, 1.096, 1.128, 1.1459]
>>> y_values = [0.989, 1.031, 1.233, 1.205, 1.158, 1.176, 1.204]
>>> z_values = [i*2 for i in y_values]
>>> df = pandas.DataFrame([x_values, y_values, z_values], columns=time, index=['x', 'y', 'z'])
>>> tsg = TimeSeriesGroup(df)
>>> tsg.mean
Out: TimeSeries(data=[1.32, 1.36, 1.58, 1.561, 1.52, 1.55, 1.58], time=[15, 30, 60, 90, 120, 150, 180], feature="mean")
>>> tsg.median
Out: TimeSeries(data=[1.48, 1.5465, 1.84, 1.8075, 1.736, 1.763, 1.806], time=[15, 30, 60, 90, 120, 150, 180], feature="median")
>>> tsg.sd
Out: TimeSeries(data=[0.8175, 0.859, 1.067, 1.031, 0.974, 0.986, 1.011], time=[15, 30, 60, 90, 120, 150, 180], feature="std")
>>> tsg.var
Out: TimeSeries(data=[0.6684, 0.738, 1.139, 1.063, 0.949, 0.972, 1.023], time=[15, 30, 60, 90, 120, 150, 180], feature="var")
>>> tsg.coeff_var
Out: TimeSeries(data=[0.471, 0.47, 0.505, 0.497, 0.484, 0.481, 0.483], time=[15, 30, 60, 90, 120, 150, 180], feature="std")
It is also possible to calculate statistics by passing a callable to TimeSeriesGroup.do_statistic()
>>> import numpy
>>> tsg.do_statistic(numpy.median)
Out: TimeSeries(data=[1.48, 1.5465, 1.84, 1.8075, 1.73, 1.76, 1.806], time=[15, 30, 60, 90, 120, 150, 180], feature="function")
Calculate the dynamic time warping distance matrix for current TimeSeriesGroup
>>> tsg.dtw_cost_matrix
Out:    x       y        a       z
x      NaN  0.3963  16.4961  8.5001
y   0.3963     NaN   15.992   7.996
a  16.4961  15.992      NaN   7.996
z   8.5001   7.996    7.996     NaN
Warning
Takes a long time for large TimeSeriesGroups
Calculate the euclidean distance matrix for current TimeSeriesGroup
>>> tsg.eucl_dist_matrix()
Out:      a          x          y          z
a        NaN  39.240745  36.747808   9.186952
x  39.240745        NaN   0.064576  10.465708
y  36.747808   0.064576        NaN   9.186952
z   9.186952  10.465708   9.186952        NaN
Compute the centroid time series using DTW distance.
The centroid is the time series in a TimeSeriesGroup that has minimum distance to all other time series in the group.
>>> tsg.centroid_by_dtw()
Out: TimeSeries(data=[0.989, 1.031, 1.233, 1.205, 1.158, 1.176, 1.204], time=[15, 30, 60, 90, 120, 150, 180], feature="y")
Compute centroid time series using euclidean distance
>>> tsg.centroid_by_eucl()
Out: TimeSeries(data=[1.978, 2.062, 2.466, 2.41, 2.316, 2.352, 2.408], time=[15, 30, 60, 90, 120, 150, 180], feature="z")
Coerce TimeSeriesGroup to numpy.array
>>> tsg.to_array()
[[[ 15.       1.    ]
  [ 30.       1.01  ]
  [ 60.       1.044 ]
  [ 90.       1.068 ]
  [120.       1.096 ]
  [150.       1.128 ]
  [180.       1.1459]]

 [[ 15.       0.989 ]
  [ 30.       1.031 ]
  [ 60.       1.233 ]
  [ 90.       1.205 ]
  [120.       1.158 ]
  [150.       1.176 ]
  [180.       1.204 ]]

 [[ 15.       2.967 ]
  [ 30.       3.093 ]
  [ 60.       3.699 ]
  [ 90.       3.615 ]
  [120.       3.474 ]
  [150.       3.528 ]
  [180.       3.612 ]]

 [[ 15.       1.978 ]
  [ 30.       2.062 ]
  [ 60.       2.466 ]
  [ 90.       2.41  ]
  [120.       2.316 ]
  [150.       2.352 ]
  [180.          2.408 ]]]
Coerce TimeSeriesGroup into a list of TimeSeries objects
>>> tsg.to_ts()
Out: [TimeSeries(data=[1.0, 1.01, 1.044, 1.068, 1.096, 1.128, 1.1459], time=[15, 30, 60, 90, 120, 150, 180], feature="x"),
      TimeSeries(data=[0.989, 1.031, 1.233, 1.205, 1.158, 1.176, 1.204], time=[15, 30, 60, 90, 120, 150, 180], feature="y"),
      TimeSeries(data=[2.967, 3.093, 3.6990000000000003, 3.615, 3.4739999999999998, 3.5279999999999996, 3.612], time=[15, 30, 60, 90, 120, 150, 180], feature="a"),
      TimeSeries(data=[1.978, 2.062, 2.466, 2.41, 2.316, 2.352, 2.408], time=[15, 30, 60, 90, 120, 150, 180], feature="z")]
Coerce TimeSeriesGroup into pandas.DataFrame
>>> tsg.as_df()
Out: 15     30     60     90     120    150     180
x  1.000  1.010  1.044  1.068  1.096  1.128  1.1459
y  0.989  1.031  1.233  1.205  1.158  1.176  1.2040
a  2.967  3.093  3.699  3.615  3.474  3.528  3.6120
z  1.978  2.062  2.466  2.410  2.316  2.352  2.4080
Normalisation
>>> tsg.norm()
Out: 15        30        60        90        120       150       180
x  0.0  0.068540  0.301576  0.466073  0.657985  0.877313  1.000000
y  0.0  0.172131  1.000000  0.885246  0.692623  0.766393  0.881148
a  0.0  0.172131  1.000000  0.885246  0.692623  0.766393  0.881148
z  0.0  0.172131  1.000000  0.885246  0.692623  0.766393  0.881148
See TimeSeriesGroup.norm()
Interpolation
>>> tsg.interpolate('linear', num=10)
Out: 15.000000   33.333333   51.666667   70.000000   88.333333   106.666667  \
x       1.000    1.013778    1.034556    1.052000    1.066667    1.083556
y       0.989    1.053444    1.176889    1.223667    1.206556    1.178889
a       2.967    3.160333    3.530667    3.671000    3.619667    3.536667
z       1.978    2.106889    2.353778    2.447333    2.413111    2.357778

   125.000000  143.333333  161.666667  180.000000
x    1.101333    1.120889    1.134961      1.1459
y    1.161000    1.172000    1.186889      1.2040
a    3.483000    3.516000    3.560667      3.6120
z    2.322000    2.344000    2.373778      2.4080
See TimeSeriesGroup.interpolation()
Differentiation
>>> tsg.dydt()
Out: 15     45     75     105    135     165
x  0.010  0.034  0.024  0.028  0.032  0.0179
y  0.042  0.202 -0.028 -0.047  0.018  0.0280
a  0.126  0.606 -0.084 -0.141  0.054  0.0840
z  0.084  0.404 -0.056 -0.094  0.036  0.0560
See TimeSeriesGroup.dydt()